The journal
you actually want to open.
Log your trades. Get your equity curve, Sharpe ratio, drawdown and more.
No formulas. No maintenance. Just your data.
7 day free trial · £6.99/month after
You know
this feeling.
Log it. See it. Understand it.
Entry, exit, direction, quantity, date. Done in under 30 seconds.
Equity curve, win rate, Sharpe ratio, profit factor, max drawdown. All calculated automatically.
Spot patterns you'd never catch in a spreadsheet. See exactly when things went wrong and why.
Everything that matters.
Nothing that doesn't.
Visual balance history across your entire trading career. See the shape of your performance at a glance.
Total, average, and per-trade breakdowns calculated automatically.
Institutional-grade risk-adjusted return metric. Know if your returns are worth the risk.
Full drill-down chart showing your worst period, the peak before it, and the trough after.
Gross profit vs gross loss. The single number that represents your profitability.
Drop in your broker export and your full history is ready instantly.
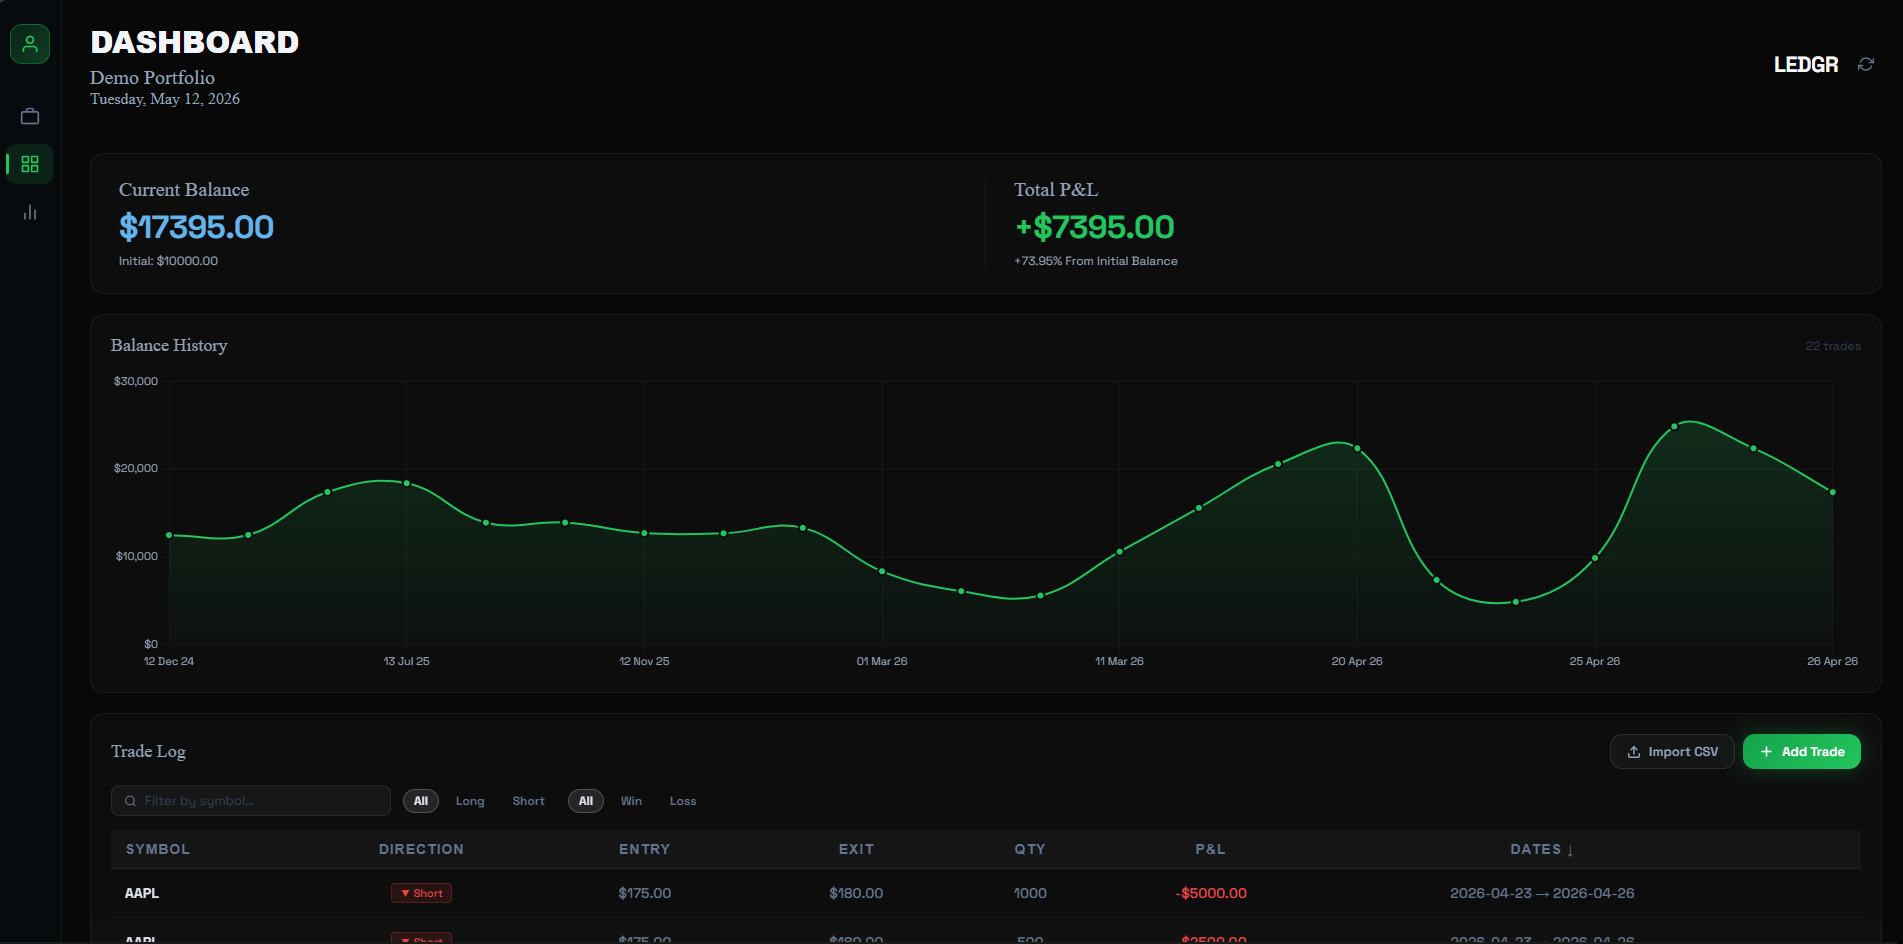
The power of LEDGR, visualised.
Every metric you need. One clean dashboard.
Traders who
ditched the spreadsheet.
I've tried every journal tool out there. LEDGR is the first one I actually open every day. I really like the clean and simple UI, making it easy for me to seemy trades.
The Sharpe ratio calculation alone saved me months of spreadsheet work. I can finally understand my risk-adjusted returns without needing to do complicated calculations.
I was sceptical about other tools, but the simplicty and low cost of £6.99 a month convinced me. It's much cheaper than other tools but just as effective if not better.
Seeing visualisations of my trading performance helped me identify patterns I would have otherwise missed. LEDGR has become an essential part of my daily routine.
Testimonials from our early private testing — try LEDGR and share your experience.
You deserve to trade
with clarity.
LEDGR gives you the metrics serious traders rely on, without the spreadsheet.
7 day free trial · £6.99/month after